z Suburban Municipality Intersection CAV (example project) Diagrams

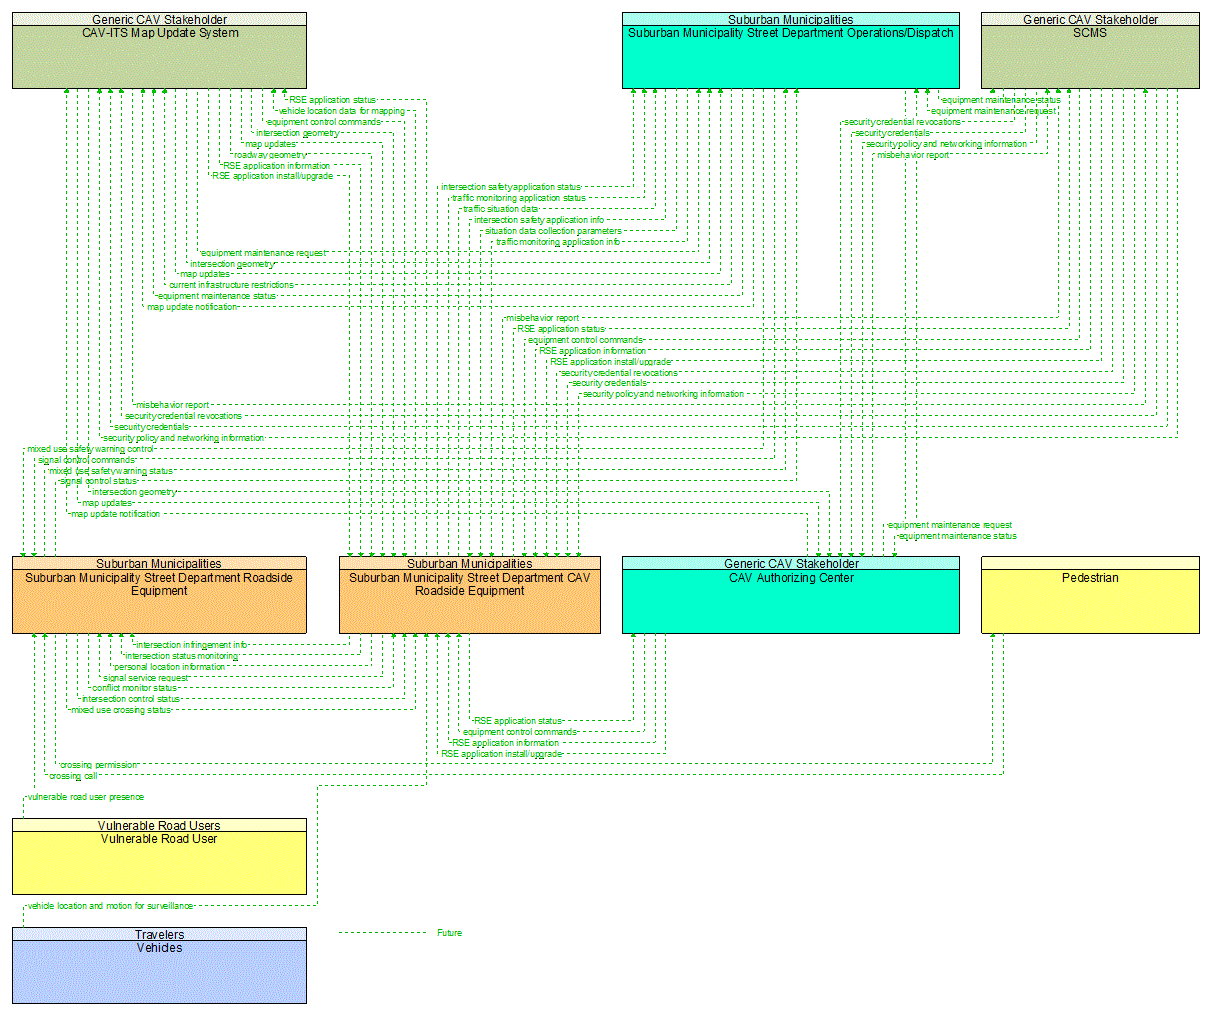
There are two diagrams below that represent this project. The first is an interconnect diagram that just shows what elements are connected to each other. The second is an information flow diagram that shows the information flowing between the connected elements.
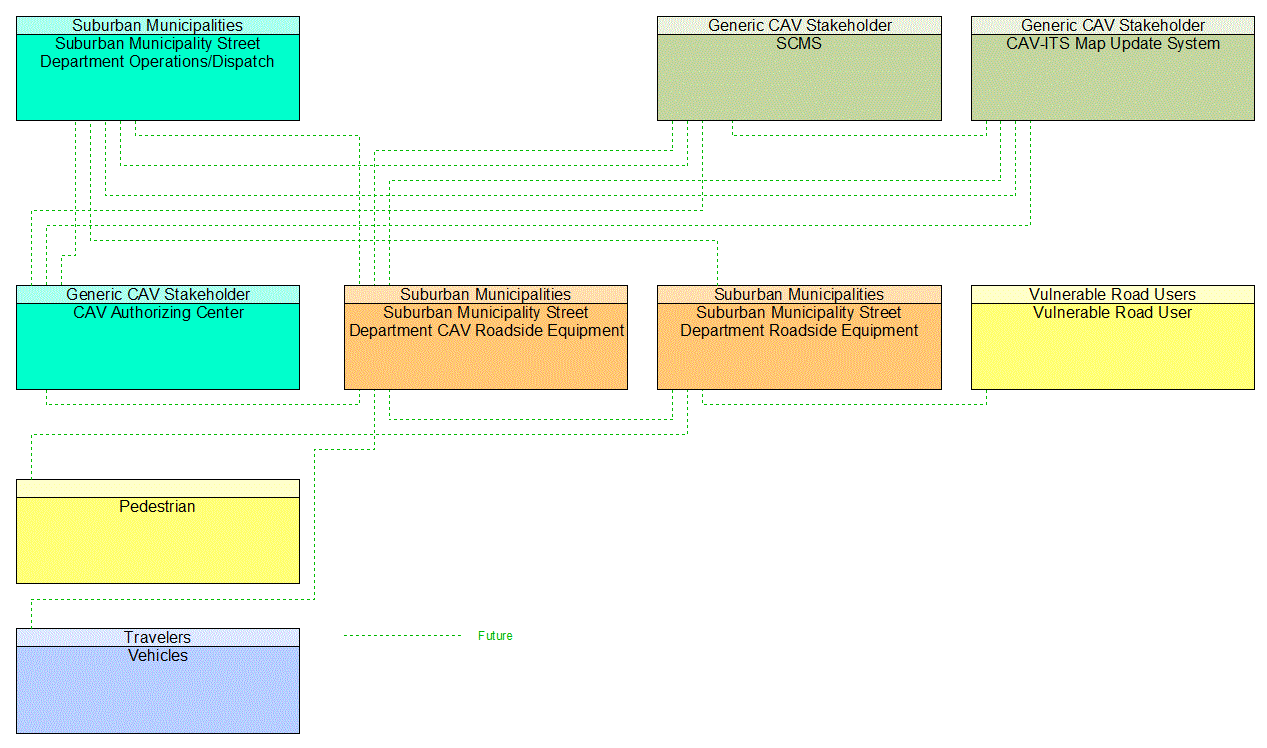
z Suburban Municipality Intersection CAV (example project) Interconnect Diagram

Project Interconnect Diagram: 6A. Support projects and policies that reduce the number and rate of serious injuries and fatalities for all modes.

z Suburban Municipality Intersection CAV (example project) Information Flow Diagram

Project Information Flow Diagram: 6A. Support projects and policies that reduce the number and rate of serious injuries and fatalities for all modes. Last Updated: 2/7/2024
Back to Top